Visualize Futures Curves and Treasury Yields
Explore how market structure changes through time in interactive three-dimensional views.
Conventional charts usually show one price series at a time. These interactive three-dimensional visualizations bring contracts, curves, and historical observations together—providing market context that is difficult to see in a standard chart.
Explore Futures Market Structure
- See the complete forward curve across available delivery months
- Follow individual contract prices through time
- Examine changes between contango and backwardation
- Compare the current curve with earlier market conditions
- Switch between the complete surface, contract price lines, and forward curves
Explore the Treasury Yield Curve
- View rates across maturities and through time
- Follow individual Treasury tenors
- Examine changes in the shape and slope of the yield curve
- Switch between surface, rate-line, and curve-line views
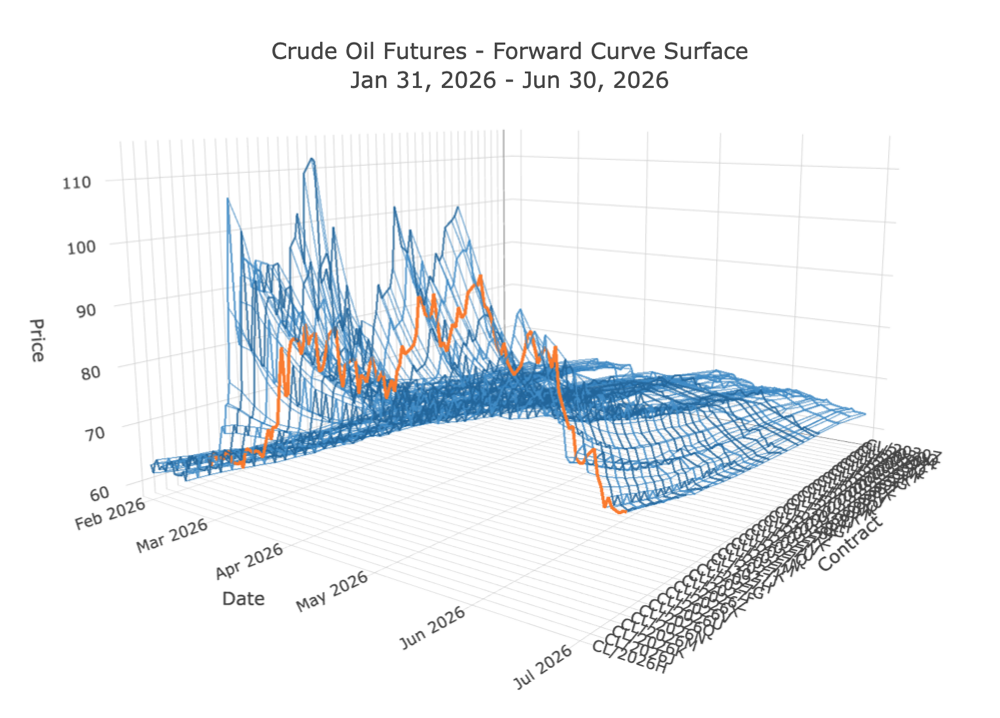
The tools are designed to help traders and market researchers examine structure, history, and context—not simply the latest price.
Disclaimer
All information is provided 'as-is' and is solely for informational purposes. It is believed to be accurate but is not guaranteed. All market data information is provided on an end-of-day basis and is delayed. No information on this site, nor any analysis presented or opinions expressed, constitutes a solicitation to buy or sell any financial contracts or securities.
Futures and options trading has large potential rewards, but also large potential risk. You must be aware of the risks and be willing to accept them in order to invest in the futures and options markets. Don’t trade with money you can’t afford to lose. This website is neither a solicitation nor an offer to Buy/Sell futures or options. No representation is being made that any account will or is likely to achieve profits or losses similar to those discussed on this website. The past performance of any trading system or methodology is not necessarily indicative of future results.
CFTC RULE 4.41 – HYPOTHETICAL OR SIMULATED PERFORMANCE RESULTS HAVE CERTAIN LIMITATIONS. UNLIKE AN ACTUAL PERFORMANCE RECORD, SIMULATED RESULTS DO NOT REPRESENT ACTUAL TRADING. ALSO, SINCE THE TRADES HAVE NOT BEEN EXECUTED, THE RESULTS MAY HAVE UNDER-OR-OVER COMPENSATED FOR THE IMPACT, IF ANY, OF CERTAIN MARKET FACTORS, SUCH AS LACK OF LIQUIDITY, SIMULATED TRADING PROGRAMS IN GENERAL ARE ALSO SUBJECT TO THE FACT THAT THEY ARE DESIGNED WITH THE BENEFIT OF HINDSIGHT. NO REPRESENTATION IS BEING MADE THAT ANY ACCOUNT WILL OR IS LIKELY TO ACHIEVE PROFIT OR LOSSES SIMILAR TO THOSE SHOWN.